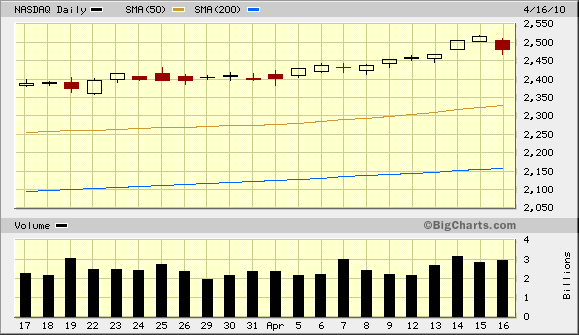
 Was yesterday's "dip" the beginning of the much anticipated market crash or was it just the market's obsessive-compulsive desire to fill a gap. I watch these gaps carefully only because I think that everyone else does. Look at the chart below and make your own decision.
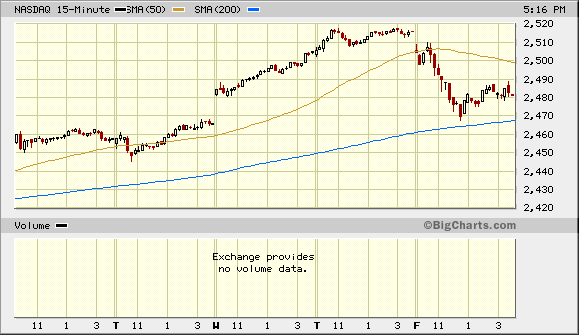
I didn't mark up the chart so you will have to look closely at the white candle on the 13th of April. The high of the day was 2467.94. On the 14th the market opened up higher and never came back down to the previous day(13th) high which created a gap between the high of the 13th and the low of the 14th. Yesterday's low was 2467.68 which closed the gap. The Nasdaq will continue on it's upward trend if the bottom of the gap provides resistance. If not, there is another gap way down (not on this chart) that needs to be closed. I would hope the CMI would be buying the QID long before that next gap is reached. The 5-day, 15 minute chart below shows the gap a little more clearly.
See the gap above the "W", and the fill just before 1pm on Friday? Looks like I'm not the only one watching these.
Which way will we go from here? The answer is obvious. We don't know or care. Since the CMI says buy, the QLD trade is still on. The lines used on the CMI chart tend to go down in unison during large one day drops which prevent quick reversal signals. This lack of knee-jerk reaction may be frustrating in the short term but the end result is more often a benefit.
Saturday, April 17, 2010
Directionally Challenged?
Labels:
Market Wrap-Up

