Monkey Throw Dart: Coppock
Showing posts with label Coppock. Show all posts

Saturday, September 21, 2013

The Updated 2013 Coppock Curve is Here!

I thought an exclamation point in the blog title might make this post more interesting.  I just remembered that I haven't updated the Coppock Curve in quite a while.  The main reason for the lack of updating is that this indicator serves no purpose at the moment since it is a buy indicator that gave its last buy signal back in 2009.  It will be useful once again when the market tanks (as it should have done this year, so says the MensaMonkey).  

The following is a "Coppock Curve basics" re-post from December 2012 that's a re-post from July 2012 (with updated chart through August 2013)...

As a refresher, the Coppock Curve was developed by a guy named Coppock. He had been asked by the Episcopal Church to identify buying opportunities for long-term investors. He thought market downturns were like bereavements and required a period of mourning so he used 11 and 14 months in his calculation after the church bishops informed him that bereavement periods generally last 11 to 14 months. Gotta love the science.

The formula is simple: Coppock = WMA[10] of (ROC[14] + ROC[11]). WMA is the weighted moving average and ROC is the rate of change. If my weighted averages are weighted in the right places, the chart now looks something like this:


A buy signal is generated when the indicator is below zero and turns upward from a trough. The last time that happened was in early 2009. That's it...end of story. If you are looking for a sell signal using the Coppock Curve you'll have similar success flipping a coin. There is only 50% accuracy for sell signals versus 80% accuracy using buy signals.

Why doesn't this work both ways? That's easy (said the monkey). Look back at the history. Coppock is using bereavement period science here. How many times have you heard someone say, "I am so happy he died. I wonder when I'll be sad again"
.

I'm assuming that we are talking about loved ones rather than enemies.
 
 
http://www.youtube.com/watch?v=-7aIf1YnbbU


Sunday, December 2, 2012

Coppock Curve Update November 2012

Time to update the Coppock Curve once again.  Instead of saying what I always have to say about the Coppock Curve, I'll use a "re-tread" post from July and insert the updated chart below.  As you can see, the Coppock line is happily drifting above the zero line which means that the buy signal from 2009 was the last signal this chart has given.  Sell signals do not apply as I always state when posting the Coppock Curve.

From July 2012 (with updated chart through November 2012)...
As a refresher, the Coppock Curve was developed by a guy named Coppock. He had been asked by the Episcopal Church to identify buying opportunities for long-term investors. He thought market downturns were like bereavements and required a period of mourning so he used 11 and 14 months in his calculation after the church bishops informed him that bereavement periods generally last 11 to 14 months. Gotta love the science.

The formula is simple: Coppock = WMA[10] of (ROC[14] + ROC[11]). WMA is the weighted moving average and ROC is the rate of change. If my weighted averages are weighted in the right places, the chart now looks something like this:

 
A buy signal is generated when the indicator is below zero and turns upward from a trough. The last time that happened was in early 2009. That's it...end of story. If you are looking for a sell signal using the Coppock Curve you'll have similar success flipping a coin. There is only 50% accuracy for sell signals versus 80% accuracy using buy signals.

Why doesn't this work both ways? That's easy (said the monkey). Look back at the history. Coppock is using bereavement period science here. How many times have you heard someone say, "I am so happy he died. I wonder when I'll be sad again"
.

I'm assuming that we are talking about loved ones rather than enemies.

Wednesday, July 4, 2012

Coppock Curve Update July 2012

Since I'm moving back into the old hut at least until the end of the world occurs (December 21st, 2012), I've blown the dust off of the old Coppock Curve data and have posted the chart, updated through June of this year.

As a refresher, the Coppock Curve was developed by a guy named Coppock. He had been asked by the Episcopal Church to identify buying opportunities for long-term investors. He thought market downturns were like bereavements and required a period of mourning so he used 11 and 14 months in his calculation after the church bishops informed him that bereavement periods generally last 11 to 14 months. Gotta love the science.

The formula is simple: Coppock = WMA[10] of (ROC[14] + ROC[11]). WMA is the weighted moving average and ROC is the rate of change. If my weighted averages are weighted in the right places, the chart now looks something like this:


A buy signal is generated when the indicator is below zero and turns upward from a trough. The last time that happened was in early 2009. That's it...end of story. If you are looking for a sell signal using the Coppock Curve you'll have similar success flipping a coin. There is only 50% accuracy for sell signals versus 80% accuracy using buy signals.

Why doesn't this work both ways? That's easy (said the monkey). Look back at the history. Coppock is using bereavement period science here. How many times have you heard someone say, "I am so happy he died. I wonder when I'll be sad again".

I'm assuming that we are talking about loved ones rather than enemies.

Monday, December 5, 2011

Coppock Curve November 2011 Update

Fool me once, shame on - shame on you. Fool me - you can't get fooled again.
~George W. Bush


Although the Cheetum Market Indicator (CMI) does not use either of these signals to determine market direction, the long term "convincers" of a major market move are the Coppock Curve and the Cheetum Curve.

This recent update to the Coppock Curve shows a continuing downward trend although changes in direction for this curve are far more useful when they swing up from the bottom.

coppock

The Cheetum Curve (not related to the CMI) is beginning to tell a scary story of a market that may be on the decline in a big way contrary to recent market action. The red line has crossed below the lower blue horizontal line. You can see what happened last time it crossed this line back in late 2007, early 2008.

cheetum curve

A refresher on using this signal is outlined below.

1. A cross of the red ROC line over the black moving average line from below when both lines are below the lower blue horizontal line triggers a 'buy' signal.

Solid confirmation occurs when both the red and black lines cross through the zero line and then continue above the upper blue line. A reversal of the red line prior to crossing through the 'zone' would trigger a sell signal as noted by the yellow arrow.

2. A cross of the red line below the bottom horizontal blue line triggers a 'sell' signal. The black moving average line is not used as an indication of a sell.

3. If the lines are in the 'zero' zone (between the blue horizontal lines, continue with the previous trend. In other words, if they are in the zone, leave 'em alone.

Sunday, September 4, 2011

Coppock Curve September 2011 Update

Although the Cheetum Market Indicator (CMI) does not use either of these signals to determine market direction, the long term "convincers" of a major market move are the Coppock Curve and the Cheetum Curve.

The Coppock had given a signal last May and continued its downward progression recently although the downtrend signals have been only 50% accurate over the years.

The 80% accurate buy signal (lines upturning below the zero line) should get more attention. The real 'Coppock action' starts below the zero line as the indicating line starts its swing upward.

coppock curve

_____________________________________________________

The Cheetum Curve is diving towards the lower horizontal blue line but no major downtrend has been confirmed yet. A refresher on using this signal is outlined below.

Cheetum curve

1. A cross of the red ROC line over the black moving average line from below when both lines are below the lower blue horizontal line triggers a 'buy' signal.

Solid confirmation occurs when both the red and black lines cross through the zero line and then continue above the upper blue line. A reversal of the red line prior to crossing through the 'zone' would trigger a sell signal as noted by the yellow arrow.

2. A cross of the red line below the bottom horizontal blue line triggers a 'sell' signal. The black moving average line is not used as an indication of a sell.

3. If the lines are in the 'zero' zone (between the blue horizontal lines, continue with the previous trend. In other words, if they are in the zone, leave 'em alone.


Related posts here.

Monday, June 6, 2011

Coppock Curve Update Mid-Year 2011

Many of the shorter term signals are looking as though they are rolling over indicating a market reversal. I am not convinced yet. Either is the CMI, although the CMI has given a few hints that it wants to cut out of the QLD trade and only needs a little push as a convincer. I get the feeling that the CMI is a little embarrassed since it has held the same QLD position as the market stealthily walks down to lower levels. Stealthily, right in front of its eyes.

Most years have at least one strong trend. If no major trend develops this year, the CMI will go trendless and friendless.

The CMI marches to its own drummer and doesn't care what the Coppock or Cheetum P/E Curve does, but here is what the updated Coppock and Cheetum P/E Curves say...

The long term "convincers" of a major market move are the Coppock Curve and the Cheetum Curve...at least in this jungle. The Coppock had given it's signal last May although the downtrend signals have been only 50% accurate over the years. Those who chose to sell using last May's sell signal would have been disappointed. The 80% accurate buy signal (lines upturning below the zero line) should get more attention. The real 'Coppock action' starts below the zero line as the indicating line starts its swing upward.

coppock curve

_____________________________________________________

The Cheetum Curve is meandering above the upper line so no major downtrend has been confirmed yet. A refresher on using this signal is outlined below.

Cheetum curve

1. A cross of the red ROC line over the black moving average line from below when both lines are below the lower blue horizontal line triggers a 'buy' signal.

Solid confirmation occurs when both the red and black lines cross through the zero line and then continue above the upper blue line. A reversal of the red line prior to crossing through the 'zone' would trigger a sell signal as noted by the yellow arrow.

2. A cross of the red line below the bottom horizontal blue line triggers a 'sell' signal. The black moving average line is not used as an indication of a sell.

3. If the lines are in the 'zero' zone (between the blue horizontal lines, continue with the previous trend. In other words, if they are in the zone, leave 'em alone.


Related posts:
Coppock Curve Update April 2011
Cheetum Curve Update March 2011

Tuesday, April 5, 2011

Coppock Curve Update (Apr '11)

For those that like to watch paint dry, here is an update to the Coppock Curve.

coppock

Not much to see here since I still don't pay much attention to the sell signals (downturn of the line when above the horizontal zero line). I would say the 2009 buy signal (upturn of the line below the horizontal zero line) is still in effect. As stated in a previous post, I use my 80/50 rule when viewing the Coppock. Recent history shows that the buy signals are about 80% accurate while the sells signals are a 'flip of the coin'.

Still, I like to keep tabs on this indicator since confirmation of a major market direction change could sneak up on you like a hungry Anaconda. Not always a bad thing judging from this scene from Anaconda 3.

hoffintrouble

They made three of these? Praise the HOFF!

Saturday, December 11, 2010

Coppock Curve, Cheetum Curve Unite!

Once in a while I check in on the status of the Coppock Curve, and the monthly rate of change indicator that I refer to as the Cheetum Curve. Both of these indicators are updated monthly and are supposed indicate major reversals in market direction. Major reversals will usually have already started so if you are on wrong side of the signal, its probably time to change direction. Details regarding these curves can be found by clicking on the hyperlinks above.

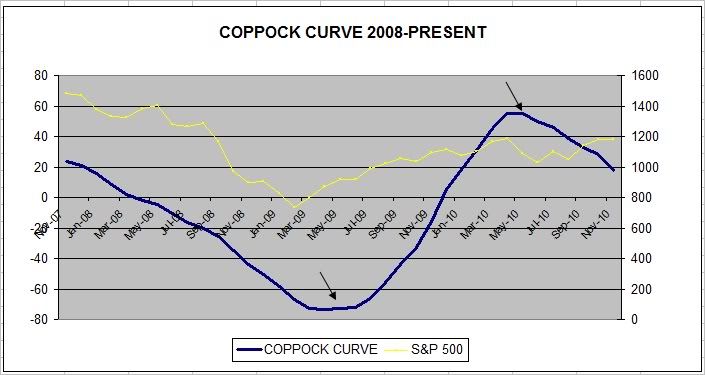
coppock

As I had stated before, the Coppock Curve does not give very accurate sell signals, so I tend to ignore those. Sell signals are indicated by a downturn above the zero line whereas buy signals are indicated by an upturn below the zero line. The Coppock chart shown here covers only two years so you can see that signals occur about as often as a lunar eclipse.

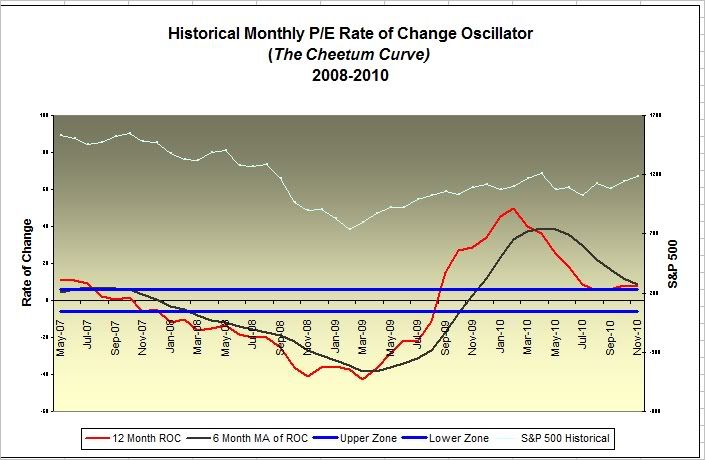
As for the experimental Cheetum Curve, (not to be confused with the shorter term, QLD-QID swapping Cheetum Market Indicator) sell signals are indicated by a cross of the red line below the lower blue horizontal line. No real danger of a massive market meltdown in sight yet according to this chart. Buy signals are indicated by a cross of the red line above the black line when they are below the horizontal lines.

cheetum curve

Again, both indicators usually serve as confirmation that the market has changed direction. Coppock produces buy signals more accurately than sell signals. The recent downward trend of the Coppock curve could be considered an early signal of a short-term market retracement but historically this has been useful only about half of the time, whereas buy signals have been about 80% accurate.