I first started trading when someone showed me a candlestick chart. I was so amazed by this that I bought Steve Nison's book on the subject and devoured the contents. Never again did I look at a stock chart unless it was of the candlestick variety.
According to Steve Nison, candlestick charting first appeared sometime after 1850. Much of the credit for candlestick development and charting goes to a legendary rice trader named Homma from the town of Sakata. It is likely that his original ideas were modified and refined over many years of trading eventually resulting in the system of candlestick charting that we use today.
The figure below shows the symbols used to describe a day in the life of a stock.
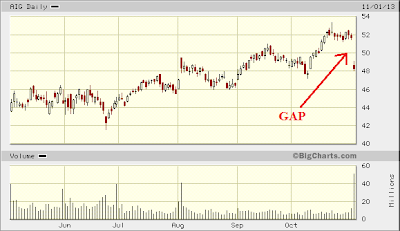
And you can see the candles at work in this recent AIG chart:
I bring this up because of the large 7% gap in price that reduced AIG's $52 share price to $48. Gaps in price fascinate me almost as much as candlesticks do. Couple that dual fascination with a little historical data dealing with gaps in price at or near 10%, and you have information that might be useful.
According to an article I read back in 2007 (I'll have to reference it later since 2007 was a long time ago), "down gaps" of around 10% just like the one you see in the chart tend to produce results at the end of a five-day period after the gap occurred which outperform a benchmark, consisting of seven million trades between 1995 and 2006, by roughly 2%. This most likely occurs because the smart money is buying rather than selling after this "massive" drop. Remember that whole "buy low, sell high" thing?
It's important try to determine why a stock would tumble so severely. Much of the time I let the candlesticks confirm my suspicions. Since when do I believe anything I read?
It may be a little early but since I believe that the next week or two for AIG will be flat or slight up, I could collect some easy premium selling a conservative covered call using a November in-the-money or at-the-money strike with maybe a little extra put thrown in there for insurance to keep the downside in check in case I jab myself in the eye again.
Gaps, candlesticks, and options. Just when I thought I was out....
http://www.youtube.com/watch?v=UPw-3e_pzqU


