The QLD buy continues even though many say the recent volumes cannot support the uptrend.
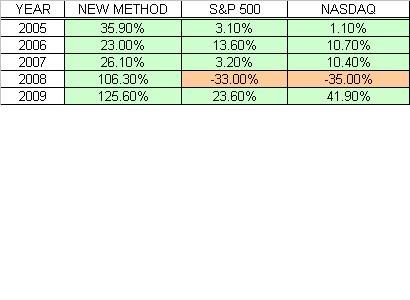
Enough about that. Take a look at the comparison chart below. this may be the final word on the CMI 2.0. The results are not as good as I had hoped but I'll take what the method has to offer. There have been about 47 trades since 2005. Half of them were winners and half were losers yet following this method would have given a trader an average of 60% per year. The large gains for 2008 and 2009 may be anomalies but it is apparent that if a trader would stick to the strategy, he would have been way ahead of a typical index fund, and more importantly, he would have avoided any major crash.
I will post all of the individual trades later. There is still some subjectivity, or "art", to this method that I am trying to eradicate.
See you soon.
skip to main |
skip to sidebar
 Hello! Sigmund here. Just a quick word about this site. Monkey Throw Dart is an informational site for traders and investors who are looking for a trading strategy that really works. Using a unique trend-following system, originally called the Cheetum Market Indicator 1.0 (CMI 1.0) which has now morphed into a beast called the MensaMonkey, the goal is still the same: Outperform the market with double digit gains every year regardless of market direction.
The stock market will never be a safe place for your savings or trading capital unless you have a plan that includes expert timing, and a good dose of risk management. This site is dedicated to leveling the playing field, or playing jungle as the case may be. No gimmicks or phony promises. Transactions and trading signals are posted as they happen so you can follow along as I sink or swim with every trade.
2013 starts the fifth year of this grand experiment so set your sights on the MensaMonkey's trade signals just below these words because the little primate's market calls are on public display as usual and can change at any time.
To learn more about the MensaMonkey trading, scroll down to the 'Posts By Category' in the sidebar below and look for MensaMonkey, or just click here.
Of course, if you end up losing money due to information posted here, don't blame me. You're the one who took advice from a chimp.
About this Site
 Hello! Sigmund here. Just a quick word about this site. Monkey Throw Dart is an informational site for traders and investors who are looking for a trading strategy that really works. Using a unique trend-following system, originally called the Cheetum Market Indicator 1.0 (CMI 1.0) which has now morphed into a beast called the MensaMonkey, the goal is still the same: Outperform the market with double digit gains every year regardless of market direction.
The stock market will never be a safe place for your savings or trading capital unless you have a plan that includes expert timing, and a good dose of risk management. This site is dedicated to leveling the playing field, or playing jungle as the case may be. No gimmicks or phony promises. Transactions and trading signals are posted as they happen so you can follow along as I sink or swim with every trade.
2013 starts the fifth year of this grand experiment so set your sights on the MensaMonkey's trade signals just below these words because the little primate's market calls are on public display as usual and can change at any time.
To learn more about the MensaMonkey trading, scroll down to the 'Posts By Category' in the sidebar below and look for MensaMonkey, or just click here.
Of course, if you end up losing money due to information posted here, don't blame me. You're the one who took advice from a chimp.
Jungle Search
Sigmund's Blog List
-
-
-
-
Why We Fail1 day ago
-
-
-
-
This is the end2 years ago
Popular Posts
Posts By Category
- Market Wrap-Up (105)
- Stocks (78)
- QLD (46)
- Stock Screener (29)
- Fun Stuff (28)
- QID (28)
- CMI 2.0 (23)
- Cheetum Method (22)
- Book Review (13)
- Linkages (13)
- CMI 3.0 (10)
- Coppock (8)
- MensaMonkey (8)
- Options (7)
- Best Trading Day (6)
- Cheetum Price/Earnings Oscillator (5)
- Fed (4)
- Prediction Retrospective (4)
- CMI 4.0 (3)
- January Barometer (3)
- Puts 9/11 (3)
- 2% Solution (2)
- Alpha test 2010 (2)
- Alpha test 2011 (2)
- ETF's (2)
- Gaps (2)
- PSQ (2)
- Super Bowl Indicator (2)
- Dow/Gold Ratio (1)
- Ponzi (1)
- The End (1)
- Welcome (1)
- XLI (1)
Posts By Month
Tree Mail
sigmundbc@hotmail.com
