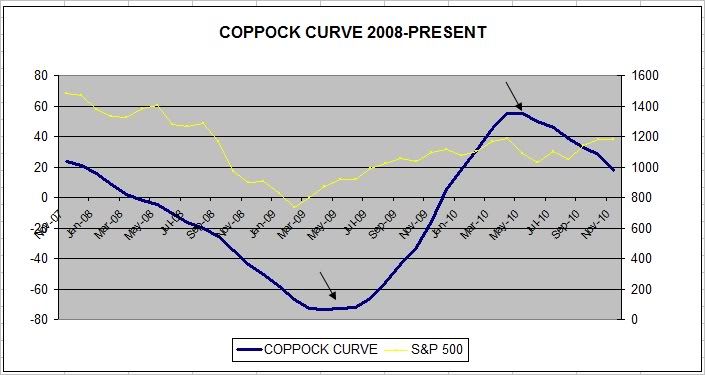
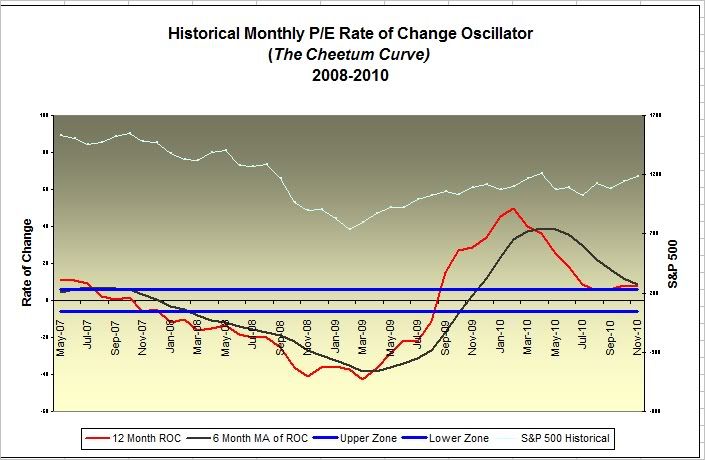
Once in a while I check in on the status of the Coppock Curve, and the monthly rate of change indicator that I refer to as the Cheetum Curve. Both of these indicators are updated monthly and are supposed indicate major reversals in market direction. Major reversals will usually have already started so if you are on wrong side of the signal, its probably time to change direction. Details regarding these curves can be found by clicking on the hyperlinks above.
As I had stated before, the Coppock Curve does not give very accurate sell signals, so I tend to ignore those. Sell signals are indicated by a downturn above the zero line whereas buy signals are indicated by an upturn below the zero line. The Coppock chart shown here covers only two years so you can see that signals occur about as often as a lunar eclipse.
As for the experimental Cheetum Curve, (not to be confused with the shorter term, QLD-QID swapping Cheetum Market Indicator) sell signals are indicated by a cross of the red line below the lower blue horizontal line. No real danger of a massive market meltdown in sight yet according to this chart. Buy signals are indicated by a cross of the red line above the black line when they are below the horizontal lines.
Again, both indicators usually serve as confirmation that the market has changed direction. Coppock produces buy signals more accurately than sell signals. The recent downward trend of the Coppock curve could be considered an early signal of a short-term market retracement but historically this has been useful only about half of the time, whereas buy signals have been about 80% accurate.
A Reckoning for the Tech Right
2 hours ago

