
Those who think the market is heading for a major downturn may be followers of the Coppock Curve. The Coppock curve is a long-term indicator developed by who else, Edwin Coppock. It uses the sum of an 11 and 14 month rate of change smoothed by a 10 period weighted moving average. Edwin thought that market downturns were like bereavements, and was told that a typical period of mourning was between 11 and 14 week, hence the rate of change time period. Genius! Gotta love the science.
Of course, you will be grieving if you follow every direction change of this curve.
The curve has been worthy of at least a glance or two, and since each data point is recorded on a monthly basis you don't have to glance that often. When the curve changes direction, so goes the market. See my two year Coppock curve below.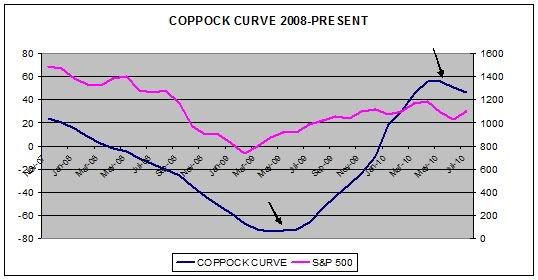
Not too many direction changes there. The "buy" direction change in May 2009 was a little "late to the party", but it put the trader on the right side. At the end of June 2010, the direction changed from an upward trend to a downward trend which indicates a downward market cycle is approaching, or has already started.
The multi-year S&P 500 Coppock curve provided by Investech gives a birds eye view of the curve since the beginning of time. Historically, the curve seems to give fairly accurate signals for a 'buy'. This is when the curve climbs out of a steep dive and reverses direction upward. Squinting at the chart, you will notice that many of the sell signals (reversals from the top) are false or very short term. (Click here to view this as a .pdf. See page 3. It's easier on the eyes).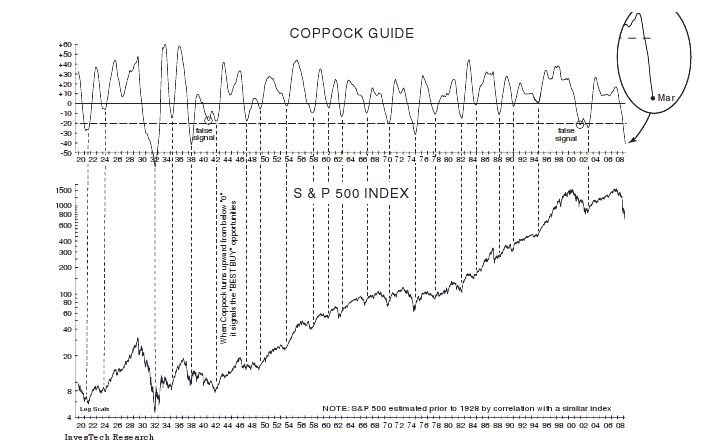
I use my 80/50 rule when viewing the Coppock. Recent history shows that the buy signals are about 80% accurate while the sells signals are a 'flip of the coin', even though very short term accuracy may be higher. In other words, I take the buy signals more seriously than the sell signals, at least from a long term perspective.
As a side note, I also use the 80/50 rule for the January barometer.
(See related Coppock Curve post here.)

Stocks and Precious Metals Charts - Sans Souci
43 minutes ago