"Price changes are not independent of each other. Research over the past few decades, by me and then by others, shows that many financial price series have a "memory", of sorts. Today does, in fact, influence tomorrow."
~Benoit Mandelbrot, The (Mis)Behavior of Markets
"When you come to a fork in the road, take it."
~Yogi Berra
I'd rather share a tree branch with an angry Jararaca than be on the wrong side of increasing market volatility. Take a look at the chart below. It shows the difference between the daily highs and lows of the NASDAQ for the last three years.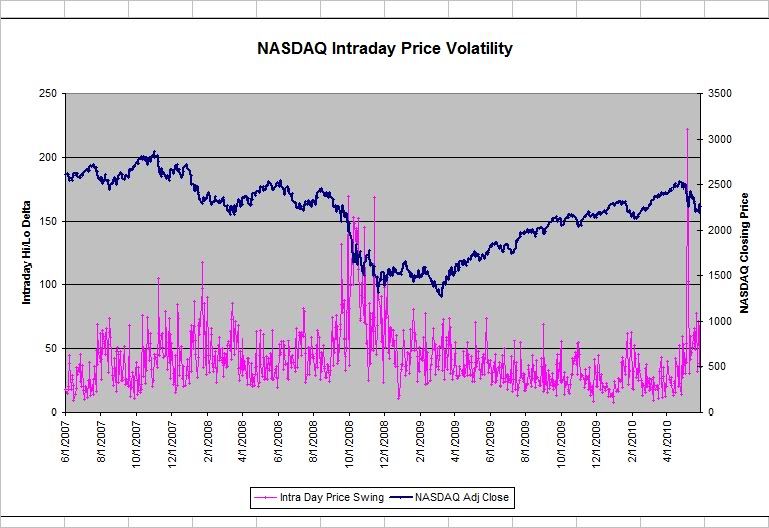
The chart is not interactive but if you were to draw a vertical line from the volatility line in the bottom half of the chart up to the NASDAQ price line you would notice that the volatility increases during the downtrends, and becomes a little more 'orderly' during uptrends.
Now, lets strip away all that magenta 'noise' and replace it with 20 day and 50 day moving average lines.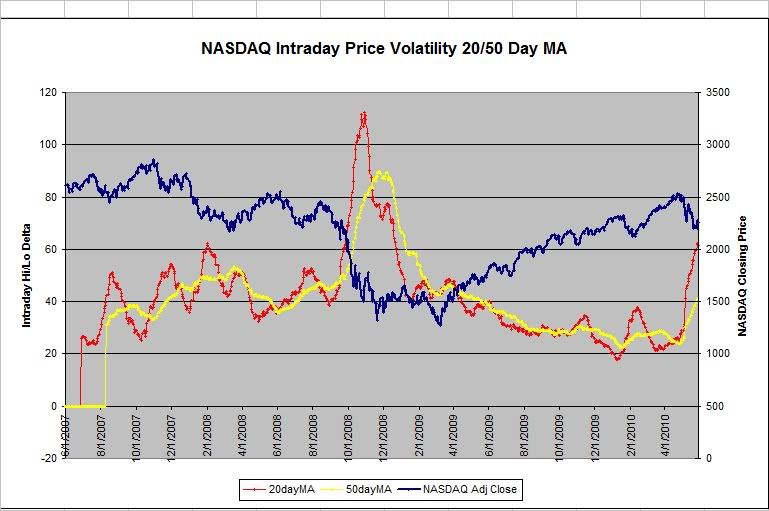
The graph sort of resembles the VIX which is the CBOE volatility index.
This is by no means a leading indicator or prediction tool but the crossing of the 20 day MA and the 50 day MA does a fair job of signaling a change of direction during this time period. (20 MA crossing the 50 MA from above to indicate an impending uptrend; 20 MA crossing from below to indicate an impending downtrend).
The timing for the most recent downtrend was especially good. The CMI 2.0 is taking the weekend off to soak up some of this homebrew for future consideration.

About this Site
 Hello! Sigmund here. Just a quick word about this site. Monkey Throw Dart is an informational site for traders and investors who are looking for a trading strategy that really works. Using a unique trend-following system, originally called the Cheetum Market Indicator 1.0 (CMI 1.0) which has now morphed into a beast called the MensaMonkey, the goal is still the same: Outperform the market with double digit gains every year regardless of market direction.
The stock market will never be a safe place for your savings or trading capital unless you have a plan that includes expert timing, and a good dose of risk management. This site is dedicated to leveling the playing field, or playing jungle as the case may be. No gimmicks or phony promises. Transactions and trading signals are posted as they happen so you can follow along as I sink or swim with every trade.
2013 starts the fifth year of this grand experiment so set your sights on the MensaMonkey's trade signals just below these words because the little primate's market calls are on public display as usual and can change at any time.
To learn more about the MensaMonkey trading, scroll down to the 'Posts By Category' in the sidebar below and look for MensaMonkey, or just click here.
Of course, if you end up losing money due to information posted here, don't blame me. You're the one who took advice from a chimp.
Sigmund's Blog List
-
-
-
-
-
-
Он раб моды ...6 days ago
-
-
This is the end2 years ago