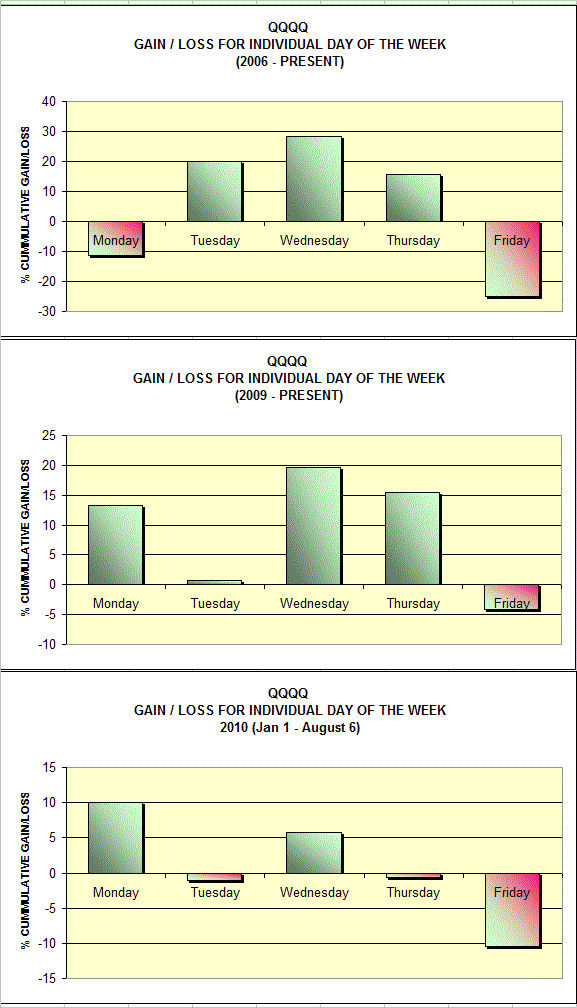
Looking at the see-saw action over the last few months, I decided to check how each day of the week compares to the others in terms of cumulative gains and losses. Since I had some QQQQ data handy I checked the percentage change from one day to the next, then sorted each day of the week and summed the gains and losses. The three resulting graphs are below. As a comparison, three time frames are used: 2006 to present; 2009-present; and year-to-date data.
Results are not too surprising. I'll be careful how I use the terms "best" and "worse" since one monkey's nightmare is another monkey's dream. Looking at the most recent graph, the best days for the 'long' crowd would be Monday and Wednesday, or near the previous day's close. The best day for the 'short' crowd would be Friday, or Thursday near the close.
(I'd rather lick a poison dart frog than go long on Thursday night...at least for a day trade).
For years, based on some old S&P 500 data, Wednesday has always been king of the week for the long side. Recently, it appears that Monday is challenging " the king" for the crown.
This information has less value to those who expect to buy and hold, but may offer an opportunity to get in at better price.
Saturday, August 7, 2010
Best and Worst Day to Trade
Labels:
Best Trading Day

