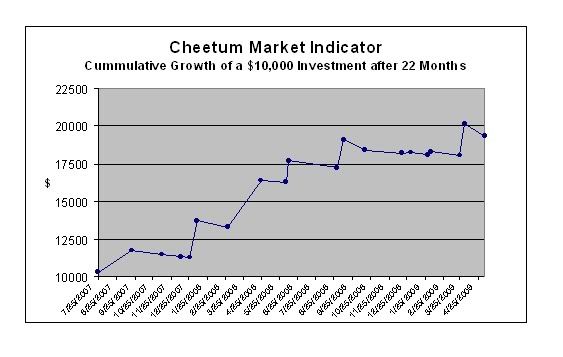
While away, the CMI bought the QLD near $35 and sold in the $32's for an 8% loss. This was a steep drawdown based on historical CMI data but since we now have 20 data points, a clearer picture of the CMI performance can be seen.
It appears that there is a distinct upward trend with generally small losses followed by large spikes over the course of the last 22 months. This looks like a clear edge that could be exploited as long as the CMI buy/sell signals are followed. It is a 'flip of the coin' as to when a profitable trade will appear, but the law of large numbers is beginning to shine through.
Gilder
3 hours ago

