Adding another dimension to the CMI 2.0 is progressing well. My modified rate of change formula (known as the "Franken-Turbo") is bonding well with all the other CMI components and may actually provide a smoother, more consistent (and profitable) ride through many of the market's peaks and troughs. Now it's just a matter of back testing. This should be done in a matter of days.
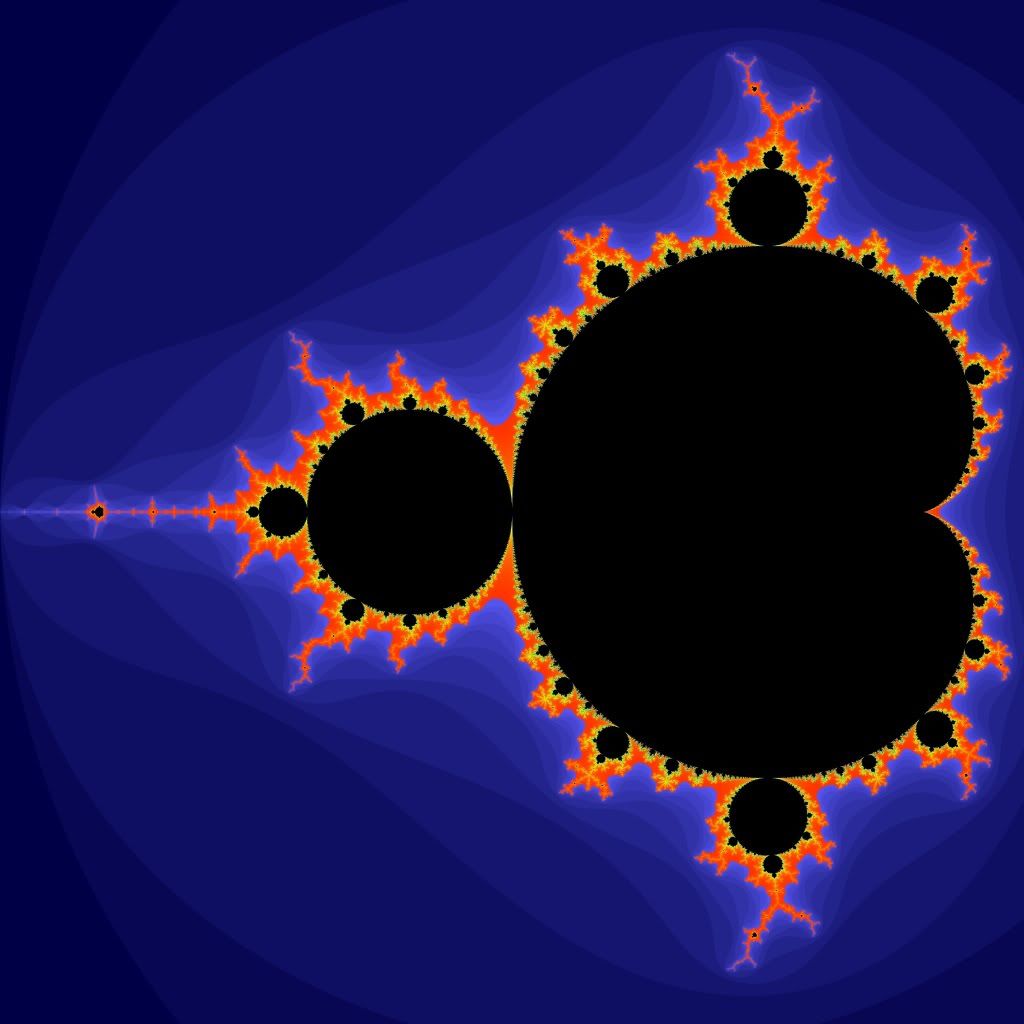
Too many hours in front of a giant spreadsheet full of colored numbers and cells, and now these things are starting to appear.
I don't know what they are but I wish someone would kill them. Could there actually be some sort of order appearing from all of my chaotic lines and graphs?
Maybe the market isn't so random after all.
Any idea what Alexander Green’s Project 53 is?
5 hours ago

