No! I said Black Lagoon...BLACK Lagoon!
Better.
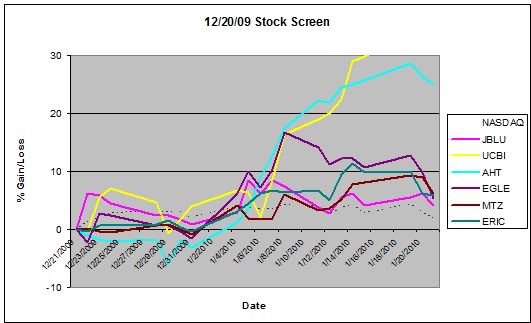
Looking back at an earlier post, I had created a simple stock screen that was intended to pluck some beat down, pond scum out from the depths using advancing/declining volume combined with some really weak relative strength. Watching the volume shift from ?% decline to ?% advance was the signal that the abused stock would come up for air. In the earlier post, I mentioned that I would review those results. Well, better late than never. (It's only been five months.) Rather than bore you with more numbers, I'll bore you with another fuzzy Excel chart...
Just look at the "0" line and you can see that there was ample opportunity to take a gain here during the twenty-one day time period. The NASDAQ was making some decent gains at the time so at some point I'll re-run this to see if I can stay above water again.
AHT was the only stock to play hard to get but it came around in the end. All stocks peaked between 10 and 21 days with gains ranging from 8.5% to 44%. Definitely worth a second look.
I usually take better notes but I'm sure I can remember the important components. I'll just have to replace the "?'s" with some frog DNA. What could go wrong?
Sunday, May 23, 2010
Stock Screen From the Black Lagoon
Labels:
Stock Screener

