On housing prices...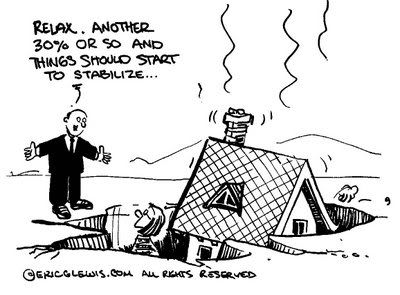
On "The Bernank"...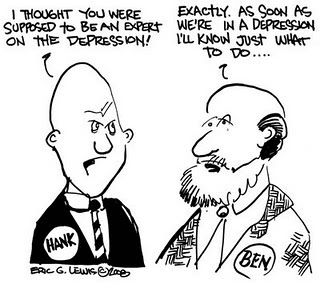
On QE...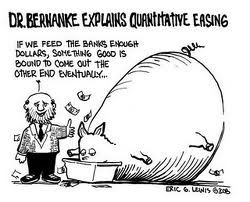
Eric Lewis

The State Department Is in Disarray
5 hours ago

Jesse Livermore on Paper Trading...
It is like the old story of the man who was going to fight a duel the next day. His second asked him, "Are you a good shot?" "Well," said the duelist, "I can snap the stem of a wine glass at twenty paces," and he looked modest. "That's all very well," said the unimpressed second. "But can you snap the stem of the wineglass while the wineglass is pointing a loaded pistol straight at your heart?"
__________________________________________________________
Linus Empathy
There's no doubt that a trending market will soon be upon us. When that is, I don't know. The challenge is to keep the losses to a minimum during trend-less periods when using a method the requires a longer trend to produce worthwhile gains.
The hindsight-biased CMI 3.0 missed key opportunities earlier in the year, although this, I believe, has been resolved with the final version of Cheetum Market Indicator. How's that for confidence in the grip of quicksand? Although the final version has not been released, the current CMI is doing a good job of mirroring the signals of the new method.
This week's QID trade just happened to be a day or two late and several dollars short. Transitions between a QID trade and QLD trade are not always pretty, but eventually do pay off over the course of the trade. This is why I check the status of the system daily but don't pay attention to the market on a daily basis unless I have a some sort of short-term trade in the works, such as the 2% Solution. Games like these keep the little chimps in the back seat quiet.
____________________________________________________________
Paper Trading the 2% Solution
Earlier in the week I took the challenge to buy a stock at the open for five consecutive days in order to achieve a 2% gain within the day, preferably within the first few minutes of the day. 2% is actually 1.7%...just go with it for now! Running a screen to extract some good candidates to buy, I actually came up with four stocks and one leveraged ETF. I decided to paper trade these using the actual opening price, so that may not reflect a true opening price, although it has been close in the past when doing this for real. So how did the challenge turn out by the end of the week? Glad you asked.
The rules for this trade were simple: buy at the open, set a stop 1.7% below the open price, and sell if the price moves up 1.7%. Simply put, I am betting that the chosen stocks make 1.7% before they lose 1.7%. The same four stocks were bought each day. I disregarded the leveraged ETF(DRN) for the test , and used GLNG, CPLA, SNDA, and KITD. Criteria for the stock selection can be found in the related post below.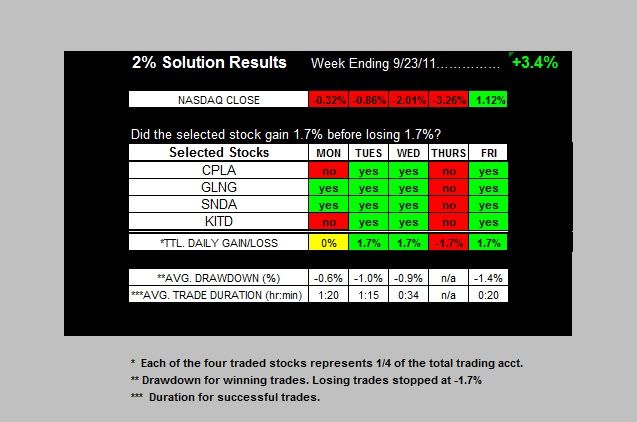
The colorful chart says this was a success...this time. A cumulative gain of 3.4% for the week, not including commissions, was attained. Not too shabby for such a lousy week...and such a tight stop. For the week, 14 of 20 trades (70%) were winners, average trade duration for the 14 winning trades was 48 minutes, and the average drawdown for the winning trades was 0.7%.
Best to have a quick trigger finger, a big day-trading account, and a low commission brokerage service.
Must have been lucky this week...so I'll try again next week while we wait for the next great market trend. Let's go with KITD, AREX, GLNG, and INT. The only change I'll make will be to have the option not trade on a day that looks real bad like Thursday of this week.
When this 2% day-trading gimmick blows up and I get a face full of banana stew, the 2% Solution will become piranha food.
Related post : Return of the 2% Solution.


The CMI 3.0 has gained over 15% since the end of July and is bobbing and weaving with the current market consolidation. The year-to-date results are still hovering around the zero line but one decent trend will push it to the profitable side.
On that note, we're back to the QID at Thursday's open.
It's not uncommon for the market to recover after a big losing day, but the quick signals won the fight within the CMI...and they have been right lately.
The "CMI next generation" is being evaluated and quietly followed in the sidebar under 'AlphaMonkey'. It's blowing the 3.0 away by 25%, and historical data will be posted soon. Note that it's holding the current trade for at least another day.

Albert Edwards, an investment strategist for Societe Generale, says a killer wave is approaching. I don't jump on the perma-bear or perma-bull bandwagon very often, or any other bandwagon for that matter, but I have to admit that this monthly MACD chart is sort of fascinating and worth a second look.
Wish I would have thought of looking at the MACD on a monthly timeframe.
The good news, if you are currently on the wrong side of this tsunami, is the fact that this is a monthly time frame so you have a little time to get to shore, or more preferably, ride it out with an inverse ETF, before being crushed.
That's if you believe in killer waves.
Saw the chart at PragCap today.

If I was challenged to buy a stock at the open with the goal of achieving a consistent 2% gain, I would look for the most consistent stocks over a short period of time that achieved something close to that result plus or minus a few tenths. Humor me and let's use 1.7% as the low side of the goal tolerance.
Some leveraged ETF's have results that are off the charts when looking at the difference between high of the day and the opening price, but surprisingly, at this moment in time, the ETF's sampled for this challenge did not match the day-to-day consistent 1.7% goal compared to the sample of individual stocks.
Based on the most recent one-month history, these stocks and ETF had a 1.7% or greater difference between the opening price and the high of the day at least 86% of the time, or 19 out of the last 22 days.
CPLA, Capella Education Company
GLNG, Golar LNG, Ltd.
SNDA, Shanda Interactive Entertainment, Ltd.
KITD, KIT Digital Inc.
DRN, Direxion Daily Real Estate Bull 3X Shrs
There's no guarantee that historical performance and future performance will agree. Even so, this is the performance trend I would use if I accepted the 2% challenge.
The real trap is that there will most likely be a high winning percentage, but it's the one or two losing trades out of ten that will burn you every time without some sort of risk management in place.
You will really do well if you know which way the market will move right after the open, or during the day. That was my attempt at dry humor.
I might track these stocks during the week to see what kind of horrific results are attained. Stay tuned.
Related post: 2% Solution
When I see a stock with the word "China" in the name, I generally move on to something less...well, Chinese. Just google (is that an acceptable verb now?) 'china stocks, delisted, halted' and you'll see what I mean if you don't know already. Numerous fabrications, reporting discrepancies regarding cash reserves and income have padded the long list of stocks bumped from the major exchanges or have lead to a trading halt.
Stocks like CIIC look so appetizing, but I don't have the stomach for the added risk. You can bet that the simmering China Infrastructure Investment Group will eventually be served with a side of WeeKukBuk, followed by the main course of NoLukChuk and YuDumFu. On the other hand, if you can find some shares to short, and don't mind the added 'cost', dig in by all means. Caveat venditor.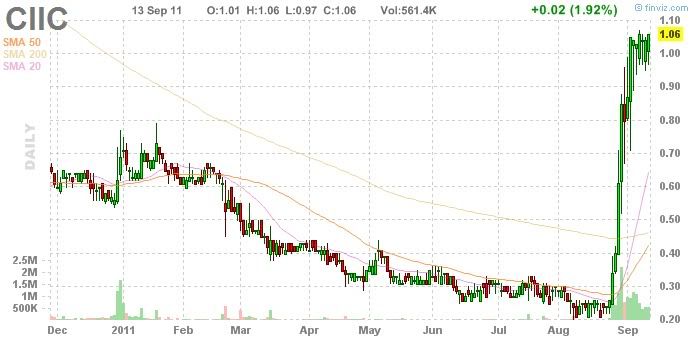
All that, and I'm still hungry.

The CMI's decision to buy the QLD at exactly the wrong time doesn't do much to inspire confidence in the 'faster signal' approach, but I'll chalk the loss up to a few growing pains and continue to look at the longer term rather than buying into the daily play-by-play noise-fest, especially in this highly volatile atmosphere.
With only 16 weeks left in the year, it's do or die for the dart throwing monkey. A flip back to the QID (wish I never left) is inevitable next week if the market spirals downward.
Time to rock the beast to sleep with the Whipsaw Song.
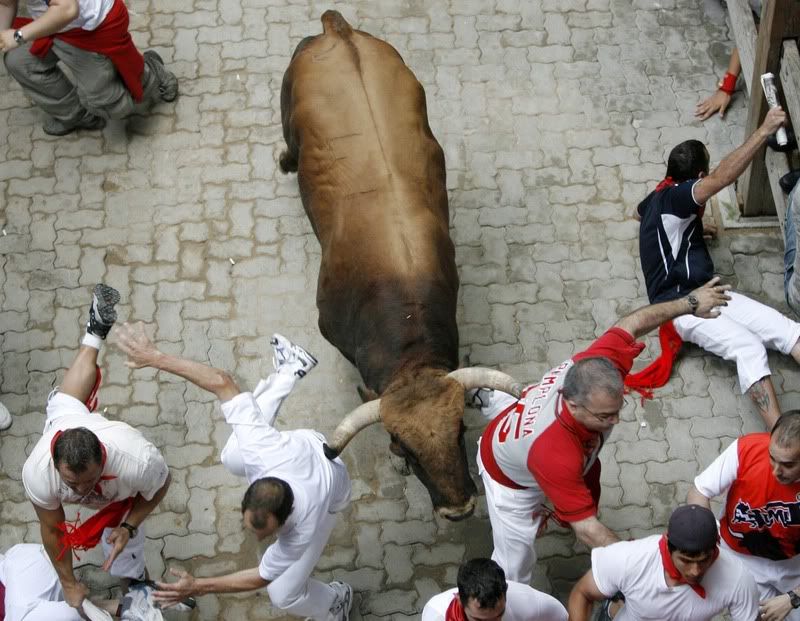
The good news is that the last QID trade resulted in a gain. The bad news is that the slightly more nimble Cheetum Market Indicator has been watching too many highlight reels of the great running back, Barry Sanders.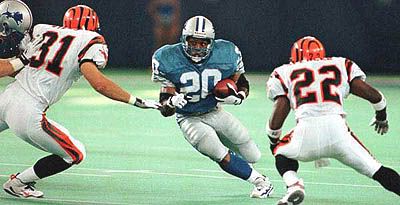
I'd much rather stick to the plan and hold a QID position, but the CMI is calling the shots. Let's hope that the CMI can turn on a dime if necessary.
Closing QID, opening QLD at tomorrow's open.
Who knows? Maybe a repeat of September 2010 is in the works, or QE3 has started and the CMI read it in the tea leaves, or in the AstroTurf.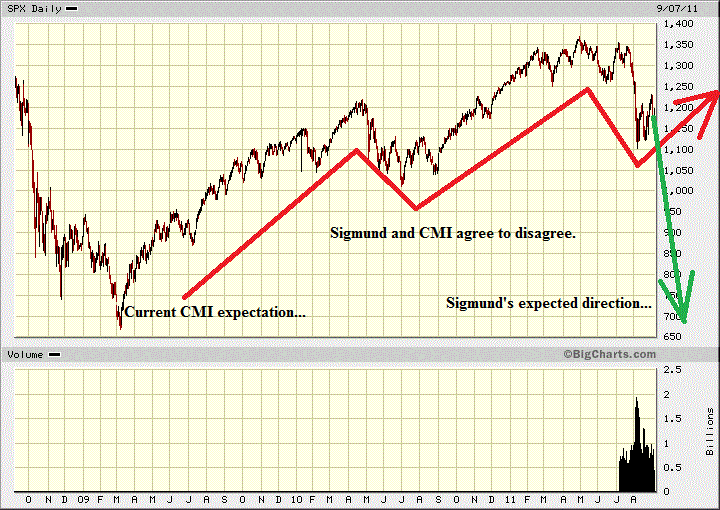
Although the Cheetum Market Indicator (CMI) does not use either of these signals to determine market direction, the long term "convincers" of a major market move are the Coppock Curve and the Cheetum Curve.
The Coppock had given a signal last May and continued its downward progression recently although the downtrend signals have been only 50% accurate over the years.
The 80% accurate buy signal (lines upturning below the zero line) should get more attention. The real 'Coppock action' starts below the zero line as the indicating line starts its swing upward.

_____________________________________________________
The Cheetum Curve is diving towards the lower horizontal blue line but no major downtrend has been confirmed yet. A refresher on using this signal is outlined below.

1. A cross of the red ROC line over the black moving average line from below when both lines are below the lower blue horizontal line triggers a 'buy' signal.
Solid confirmation occurs when both the red and black lines cross through the zero line and then continue above the upper blue line. A reversal of the red line prior to crossing through the 'zone' would trigger a sell signal as noted by the yellow arrow.
2. A cross of the red line below the bottom horizontal blue line triggers a 'sell' signal. The black moving average line is not used as an indication of a sell.
3. If the lines are in the 'zero' zone (between the blue horizontal lines, continue with the previous trend. In other words, if they are in the zone, leave 'em alone.
Related posts here.

Place looks like a pack of wildebeests got loose. Printouts, charts, and poison dart frogs everywhere. Finishing a dangerous experiment putting the mellow into some fast signals. Final version of CMI just around the corner...yeah, I said final. Less appears to be more; reduced trades by 70% over last three years with best annual results ever. Backtesting can be a fickle beast so re-re-rechecking all data and forward-testing as I write. Putting finishing touches on a Coppock curve update for September in my spare time. Still can't understand why they don't spell Xanax with a "Z".
Temp agency sent over some help...

I'm scared. I don't think she likes monkeys.
Switching to de-caf, stat.
Take care,
Sig
 Hello! Sigmund here. Just a quick word about this site. Monkey Throw Dart is an informational site for traders and investors who are looking for a trading strategy that really works. Using a unique trend-following system, originally called the Cheetum Market Indicator 1.0 (CMI 1.0) which has now morphed into a beast called the MensaMonkey, the goal is still the same: Outperform the market with double digit gains every year regardless of market direction.


